Introducing the RUSTIK Viewer Handbook

Rural areas across Europe are undergoing profound social, economic, environmental and digital transitions. Yet, these changes are often hidden behind averages and national statistics, making it hard for policymakers, researchers and local actors to truly see what is happening on the ground. That is precisely the gap the RUSTIK Data Viewer and the new RUSTIK Viewer Handbook aim to fill.


What is the RUSTIK Data Viewer?

The RUSTIK Data Viewer is an online, interactive mapping platform that brings together a wide range of territorial indicators on rural Europe. It allows users to visualise and analyse:

  • Socioeconomic dynamics such as population change, depopulation, social inclusion, access to services, employment and education.
  • Environmental transition including climate risks (wildfires, droughts, heavy precipitation), land cover and land use, natural resources, protected areas and air quality.
  • Digital transition through indicators on connectivity and digital infrastructure.
  • Local experimentation with data from 14 RUSTIK Living Labs, where rural communities co-create knowledge and test new approaches.

The Viewer combines harmonised European datasets (e.g. from EU statistical and environmental agencies) with more granular local information, enabling comparisons between regions as well as deep dives into specific territories.


What does the Viewer Handbook offer?

The newly released RUSTIK Viewer Handbook is a practical companion designed to help users get the most out of the platform. It serves several purposes:

  • Onboarding new users: It explains the overall structure of the RUSTIK Data Viewer, its main components, and the types of indicators available.
  • Guided exploration: It walks through the different thematic areas (socioeconomic, environmental, digital and Living Labs) and shows how to navigate maps, layers and territorial units.
  • Interpretation support: It describes what each group of indicators tells us about rural transitions—for example, how to read demographic trends, what “service deserts” look like on a map, or how climate projections can inform local adaptation strategies.
  • Technical transparency: It details how the system is built (spatial database, map server, web viewer, security) and which reference datasets are integrated, helping users understand the robustness and limitations of the data they use.

Whether you are a local authority wanting to diagnose challenges in your territory, a researcher comparing regions, or an innovation actor working in a Living Lab, the handbook is designed as a bridge between complex data infrastructure and practical, real-world questions.


Why this matters for rural policy and practice

Rural territories face intertwined challenges: aging populations and outmigration, unequal access to services, exposure to climate risks, pressure on ecosystems, and gaps in digital connectivity. At the same time, they hold crucial assets for Europe’s future: food production, biodiversity, renewable energy and cultural heritage.

The RUSTIK Data Viewer helps make these realities visible by:

  • Revealing spatial inequalities that national averages can hide.
  • Allowing users to combine different dimensions (e.g. demographics, services and mobility) in the same analysis.
  • Supporting evidence-based decision-making, from strategic planning and funding applications to monitoring the impact of policies over time.

The Viewer Handbook turns this potential into something accessible: a clear, structured guide that shows where to start, which indicators to use for which questions, and how to interpret what appears on the map.


Who is the handbook for?

The guide is especially useful for:

  • Local and regional administrations working on rural development, cohesion policy, climate adaptation, or service planning.
  • Researchers and analysts interested in territorial data, sustainability transitions and rural inequalities.
  • Living Lab partners and practitioners who need to connect local insights with broader European trends.
  • Civil society organisations looking for robust, visual evidence to inform advocacy and community projects.

If you work with rural territories and need to ground your decisions in data, the combination of the RUSTIK Data Viewer and the Viewer Handbook is designed for you.

RUSTIK Data Viewer Now Available! Empowering Rural Sustainability Transitions

Rustik Data viewer now available!

We are thrilled to unveil the launch of the RUSTIK Data Viewer, a powerful tool designed to revolutionise evidence-based decision-making and drive positive impacts in rural sustainability transitions.

What is the RUSTIK Data Viewer?

The RUSTIK Information System is more than just a tool; it’s a reliable resource crafted to facilitate comprehensive insights into rural sustainability transitions, encompassing social, economic, environmental, and digital dimensions. At its core, the system serves as a centralized platform, providing seamless access to data meticulously curated within the RUSTIK Database.
 

Who Benefits from the RUSTIK Data Viewer?

This innovative system isn’t just for researchers and policymakers; it’s for anyone passionate about rural sustainability. From policymakers shaping legislative frameworks to academics conducting groundbreaking research, the RUSTIK Data Viewer caters to a diverse spectrum of stakeholders invested in rural development.

Key Features and Functionalities:

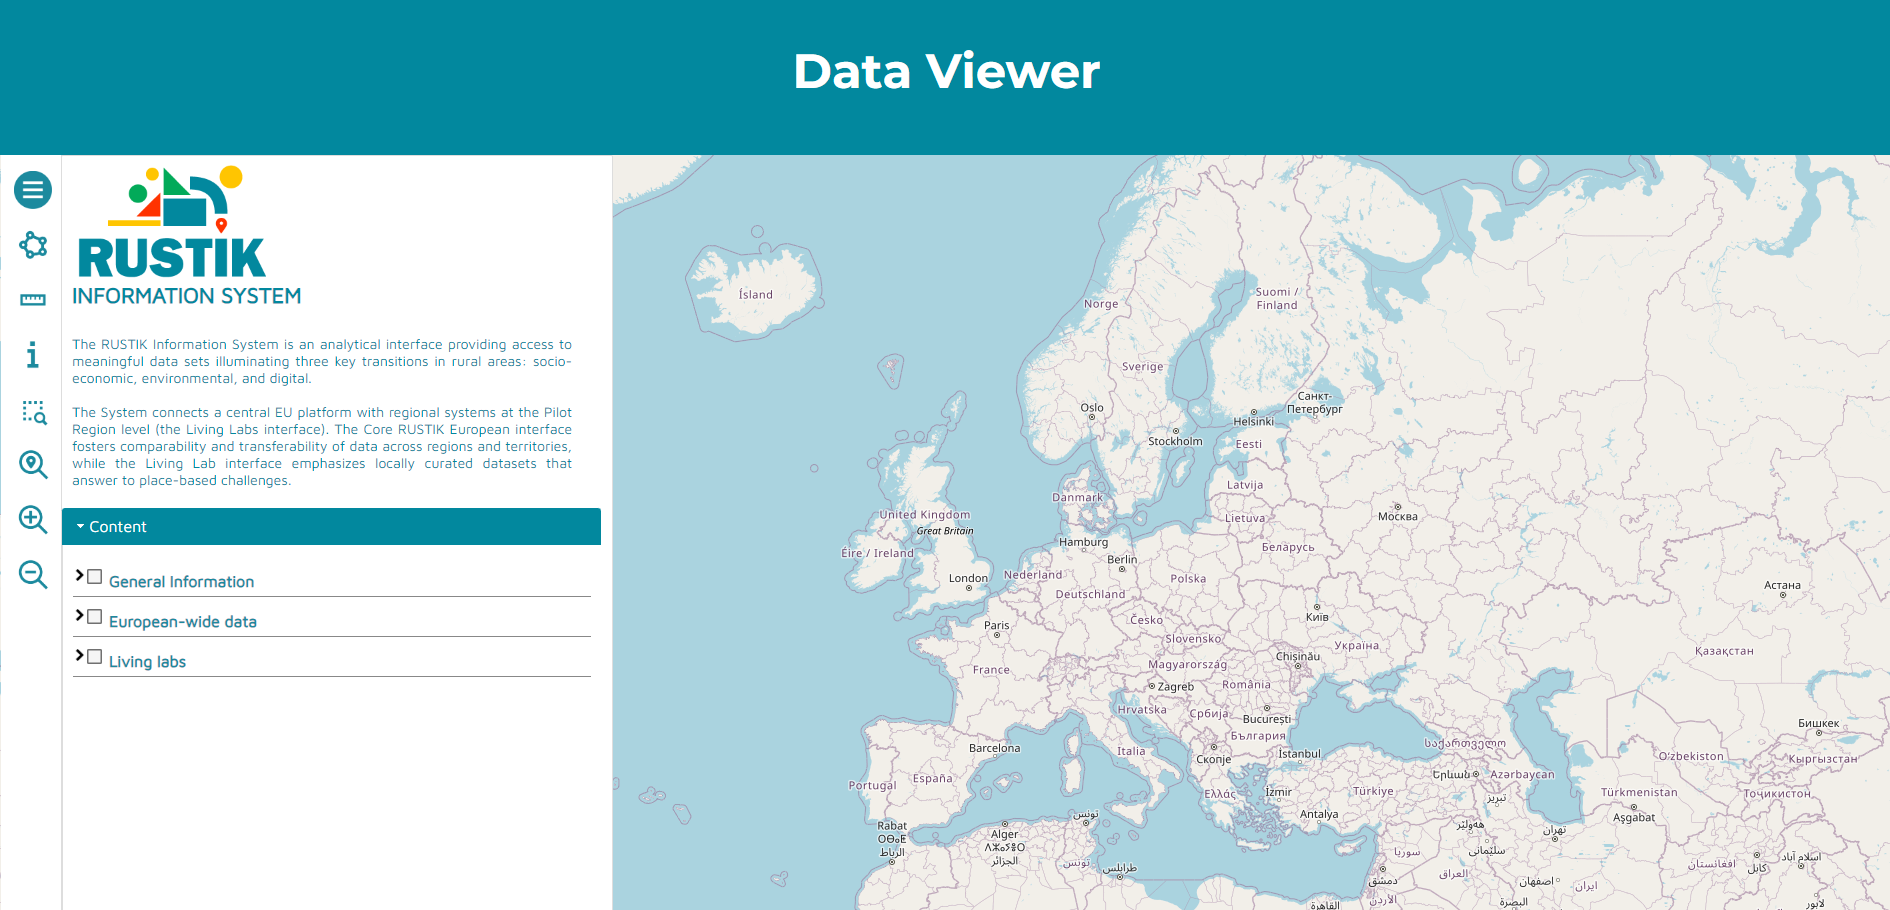
The RUSTIK Data Viewer boasts an intuitive user interface designed with your convenience in mind. Navigate effortlessly through layers of data, gaining valuable insights at every turn. Here’s a glimpse of what awaits you:

  • Layers Menu: Seamlessly transition between the European Core and 14 Living Lab Cores.
  • Area Draw Tool: Customize shapes and areas on the map to suit your analysis.
  • Measure Tool: Accurately measure distances to inform your decision-making process.
  • Information Tool: Dive deep into specific elements or locations on the map, accessing associated attributes with ease.
  • Zoom Functionality: From zooming into specific regions to gaining a holistic view of the entire EU extension, the zoom features empower you to explore with precision.

The Richness of RUSTIK Database:

The backbone of the RUSTIK Data Viewer lies in the extensive RUSTIK Database, meticulously curated to capture economic, social, and environmental indicators. From sectors and employment to quality of life and climate change mitigation, our database is a treasure trove of invaluable insights.

Unveiling Diverse Data Sources:

Our commitment to robust analysis extends to diverse data sources, including:

  • Data from European agencies and programs, such as Eurostat and the European Environmental Agency.
  • Insights from private actors, NGOs, and research institutions, enriching our understanding of consumer behavior and specialized research.
  • Geo-data scraping from platforms like Open Street Map and Google Maps, offering a wealth of geospatial information for in-depth analysis.


The RUSTIK Viewer isn’t just a tool; it’s a catalyst for change. Join us as we embark on a journey to transform rural sustainability transitions. Explore the RUSTIK Data Viewer today and be part of the movement towards a more sustainable future.

At RUSTIK, we believe in the power of data to drive meaningful change. With the RUSTIK Viewer, we empower you to make informed decisions that pave the way for a brighter, more sustainable tomorrow.

Visit our website to access the RUSTIK Data Viewer and unlock a world of possibilities. Together, let’s shape the future of rural sustainability, one data point at a time.